Death Statistics Tables: An Overview
Death statistics tables, also known as mortality tables, are crucial tools in demography and public health. They provide comprehensive data on deaths, allowing for the analysis of mortality patterns and trends. These tables typically include data on variables such as age, sex, race, and cause of death.
Key Components of Death Statistics Tables
1. Number of Deaths: This is the total count of deaths in a specific population during a particular period.
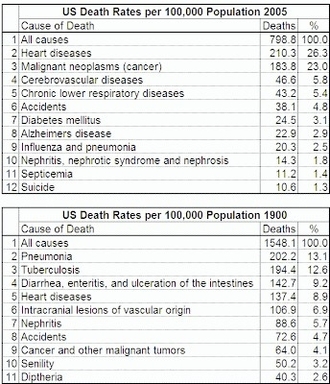
2. Death Rate: This is the number of deaths per unit of population, often per 100,000 people.
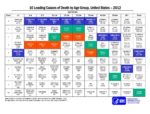
3. Cause of Death: This refers to the specific diseases or injuries that led to death.
4. Age-Specific Death Rate: This is the death rate for a specific age group.
5. Life Expectancy: This is the average number of years a person is expected to live.
ignificance of Death Statistics Tables
Death statistics tables serve several purposes:
1. Public Health Planning: They help identify public health issues and guide the allocation of health resources.
2. Policy Making: They provide evidence for policy decisions, such as those related to healthcare funding and disease prevention strategies.
3. Research: They are essential for epidemiological studies, helping researchers understand disease patterns and risk factors.
Trends in Death Statistics
In Canada, there were 334,623 deaths in 2022, a 7.3% increase from 2021. The age-standardized mortality rate also increased from 907.2 deaths per 100,000 population in 2021 to 972.5 deaths in 2022. Cancer and heart disease remained the two leading causes of death, accounting for 41.8% of deaths in 2022.
Conclusion
Death statistics tables are vital tools for understanding mortality patterns and trends. They provide valuable insights for public health planning, policy making, and research. As our population grows and ages, these tables will continue to play a crucial role in guiding our responses to health challenges.